
Triaging large packet captures is a daunting task, even for the most seasoned security analysts. With a mountain of data and few leads, analysts need to find ways to pare down what they've captured and focus on the areas that have the highest chance of producing results. In this blog we present four TShark commands and strategies we use to tackle this challenge.
If analysis is being performed on a large packet capture -- something too large to reasonably work with in Wireshark -- and there are no initial leads to pursue, then a good starting point is to summarize what the capture contains. This information can inform the next steps of analysis and ultimately help remove the uninteresting parts. Using TShark, we will gather statistics of traffic within the capture to understand the most valuable pieces of information we need to begin: protocol use, infrastructure, and conversations.
1. Protocols
First, we will get a feel for the protocols in the capture. This helps identify low security value protocols and understand what devices are in the capture. It's important to recognize that protocol classifications can be incorrect, so questionable items may require a closer look later on. To view the protocol classification for a capture, we can use the following TShark command:
tshark -q -r
This produces a list of protocols in a hierarchical fashion, similar to the truncated example below:
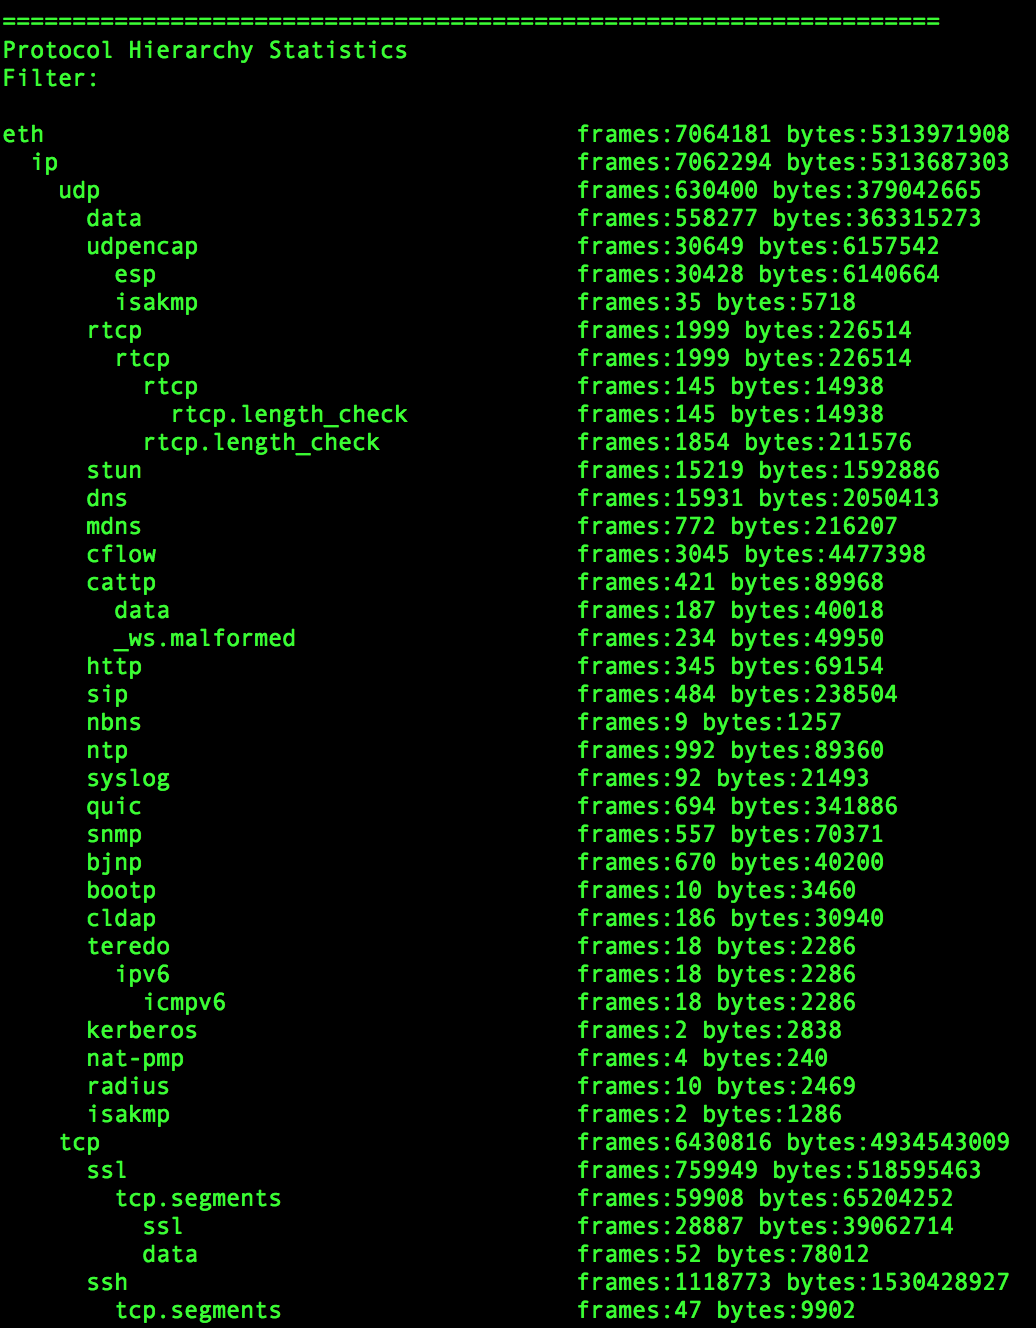
Figure 1. Sample Protocol Hierarchy Statistics
The more diverse the PCAP, the more complicated and messy this becomes. Focus on understanding the major protocols present and what percentage of the PCAP they represent. What is the breakdown of TCP vs UDP? How much HTTP, DNS, SSL, SMTP, SSH, SMB, and FTP traffic does it contain?
There is a wealth of information in these results to build filters for further analysis. We will dive deeper on how to utilize this information further in future blog posts. At this point use the information to hypothesize what the network represented by the PCAP looks like.
2. Infrastructure - Hosts
After understanding the protocol makeup, get a sense for the capture's infrastructure composition. Since we are looking to reduce the size of our dataset, we need to identify hosts that are likely associated with legitimate traffic. But we also want to keep a clear and concise filter, so we want to ensure that any filtered hosts have enough traffic to make filtering worthwhile. We can accomplish this by looking at traffic summary by hostname.
To generate a list of hostnames and associated IPs, use:
tshark -q -r
From this list you can begin to identify benign hostnames to filter. For example, removing legitimate services such as Google or Netflix. You can also use this command to identify suspicious hostnames for further investigation. Take it one step further by seeing how the hostnames rank on the Cisco Umbrella 1 Million List.
3. Infrastructure - IPs
Similar to hosts, certain IPs may create a large amount of traffic that isn't interesting for security purposes. Displaying the top talkers is another effective method for identifying endpoints to filter. To get a sense of which IPs generate the most traffic in the capture, we use the TShark command:
tshark -q -r
By default, the results are ordered by descending packet count. We are generally more interested in total byte count at this point, but packet numbers often correlate well with total byte counts. The output of this command will likely be a large list with some RFC1918 IPs at the top. It's usually worthwhile to look at the whois of some of the top non-RFC1918 IPs. Additionally, this data can be married with the hostnames output to identify which hostnames are involved with the majority of the traffic.
4. Conversations
Our final method for paring down the capture is based around large IP conversations. This can be a vital step in understanding why some of the IPs listed from the step above have so much traffic. Additionally it can inform you the role of certain IPs and highlight devices you can remove from the focus of your investigation.
This information can be produced using the command:
tshark -q -r
This command will produce another long list, but it will likely highlight a number of noisy talkers.
Wrapping Up
Large PCAP files can contain a lot of information making timely triage a difficult task. After using these commands, you will have a number of data points with which to begin trimming down your packet capture. You should also use leads for the next steps of your investigation. In subsequent blog posts we will discuss how to further analyze these results.